Portfolio Optimizer Pro
What are your fund fees really costing you?
Tap the funds you own
Even weights to start. You can adjust weights after the checkup.
Free · No signup · Educational, not investment advice
Or type your funds and weights
Illustration only: 0.2% a year on $100,000 costs $5,829 over 30 years (zero gross return, no contributions or taxes). Not your actual fund fees.
Fee assumptions and sources
Same flat balance at an illustrative 0.03% fee: $896. No forecast or growth assumption.
What the checkup measures
- Input portfolio structure and observable concentration
- Historical volatility and measured drawdown
- Dated issuer references and explicit missing-data notices
Monthly price histories come from the available market-data providers. Each result shows its actual history dates. Fund classifications and expense ratios use dated issuer references; exact common-holding percentages are not inferred.
No account needed. We don’t sell your data or connect to your brokerage.
Sample result
VTI 50% · VXUS 30% · BND 20% — A−
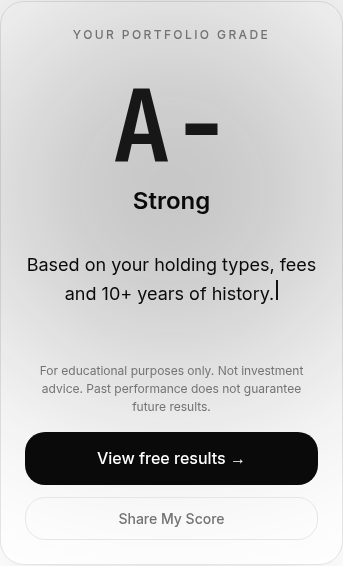
Actual demo checkup, not a customer outcome. Your grade depends on your holdings and available data.
Built by an Investor Who Lost 18% in 2022
"I thought I was diversified — multiple tech stocks and ETFs. Then 2022 hit, and my portfolio dropped 18% while the market only fell 12%. I realized no simple tool could show me my real risk. So I built one."
Founder & Builder, Portfolio Optimizer Pro
Questions
Does this recommend purchases or sales?
No. Results and hypothetical comparisons are educational.
Are exact overlapping holdings available?
No. Known fund mandates can overlap; exact overlap needs reliable licensed holdings.
What costs money?
A Deep Analysis report costs $12 once: a dated snapshot of those exact holdings. Pro, which stays current, costs $15/month or $129/year. Weekly alerts are coming soon.