Portfolio Optimizer Pro
Portfolio Visualizer alternative
Portfolio Optimizer Pro: a free-first structure and risk checkup with no brokerage connection.
Free checkup · No signup required · Educational, not investment advice
What the checkup measures
- Input portfolio structure and observable concentration
- Historical volatility and measured drawdown
- Dated issuer references and explicit missing-data notices
Monthly price histories come from the available market-data providers. Each result shows its actual history dates. Fund classifications and expense ratios use dated issuer references; exact common-holding percentages are not inferred.
No account needed. We don’t sell your data or connect to your brokerage.
Sample result
VTI 50% · VXUS 30% · BND 20% — A−
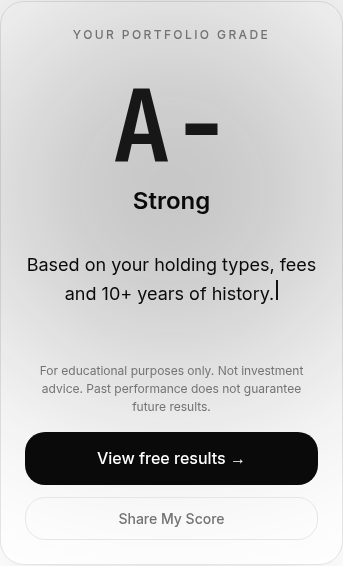
Actual demo checkup, not a customer outcome. Your grade depends on your holdings and available data.
Compare the tools directly
We do not claim feature parity or independently verified superiority. Review current features and pricing at Portfolio Visualizer. This checkup focuses on a structure grade and transparent historical risk; exact licensed fund look-through remains unavailable.

Built by an Investor Who Lost 18% in 2022
"I thought I was diversified — multiple tech stocks and ETFs. Then 2022 hit, and my portfolio dropped 18% while the market only fell 12%. I realized no simple tool could show me my real risk. So I built one."
Alex Purdy
Founder & Builder
Questions
Does this recommend purchases or sales?
No. Results and hypothetical comparisons are educational.
Are exact overlapping holdings available?
No. Known fund mandates can overlap; exact overlap needs reliable licensed holdings.
What costs money?
A Deep Analysis report costs $12 once: a dated snapshot of those exact holdings. Pro, which stays current, costs $15/month or $129/year. Weekly alerts are coming soon.